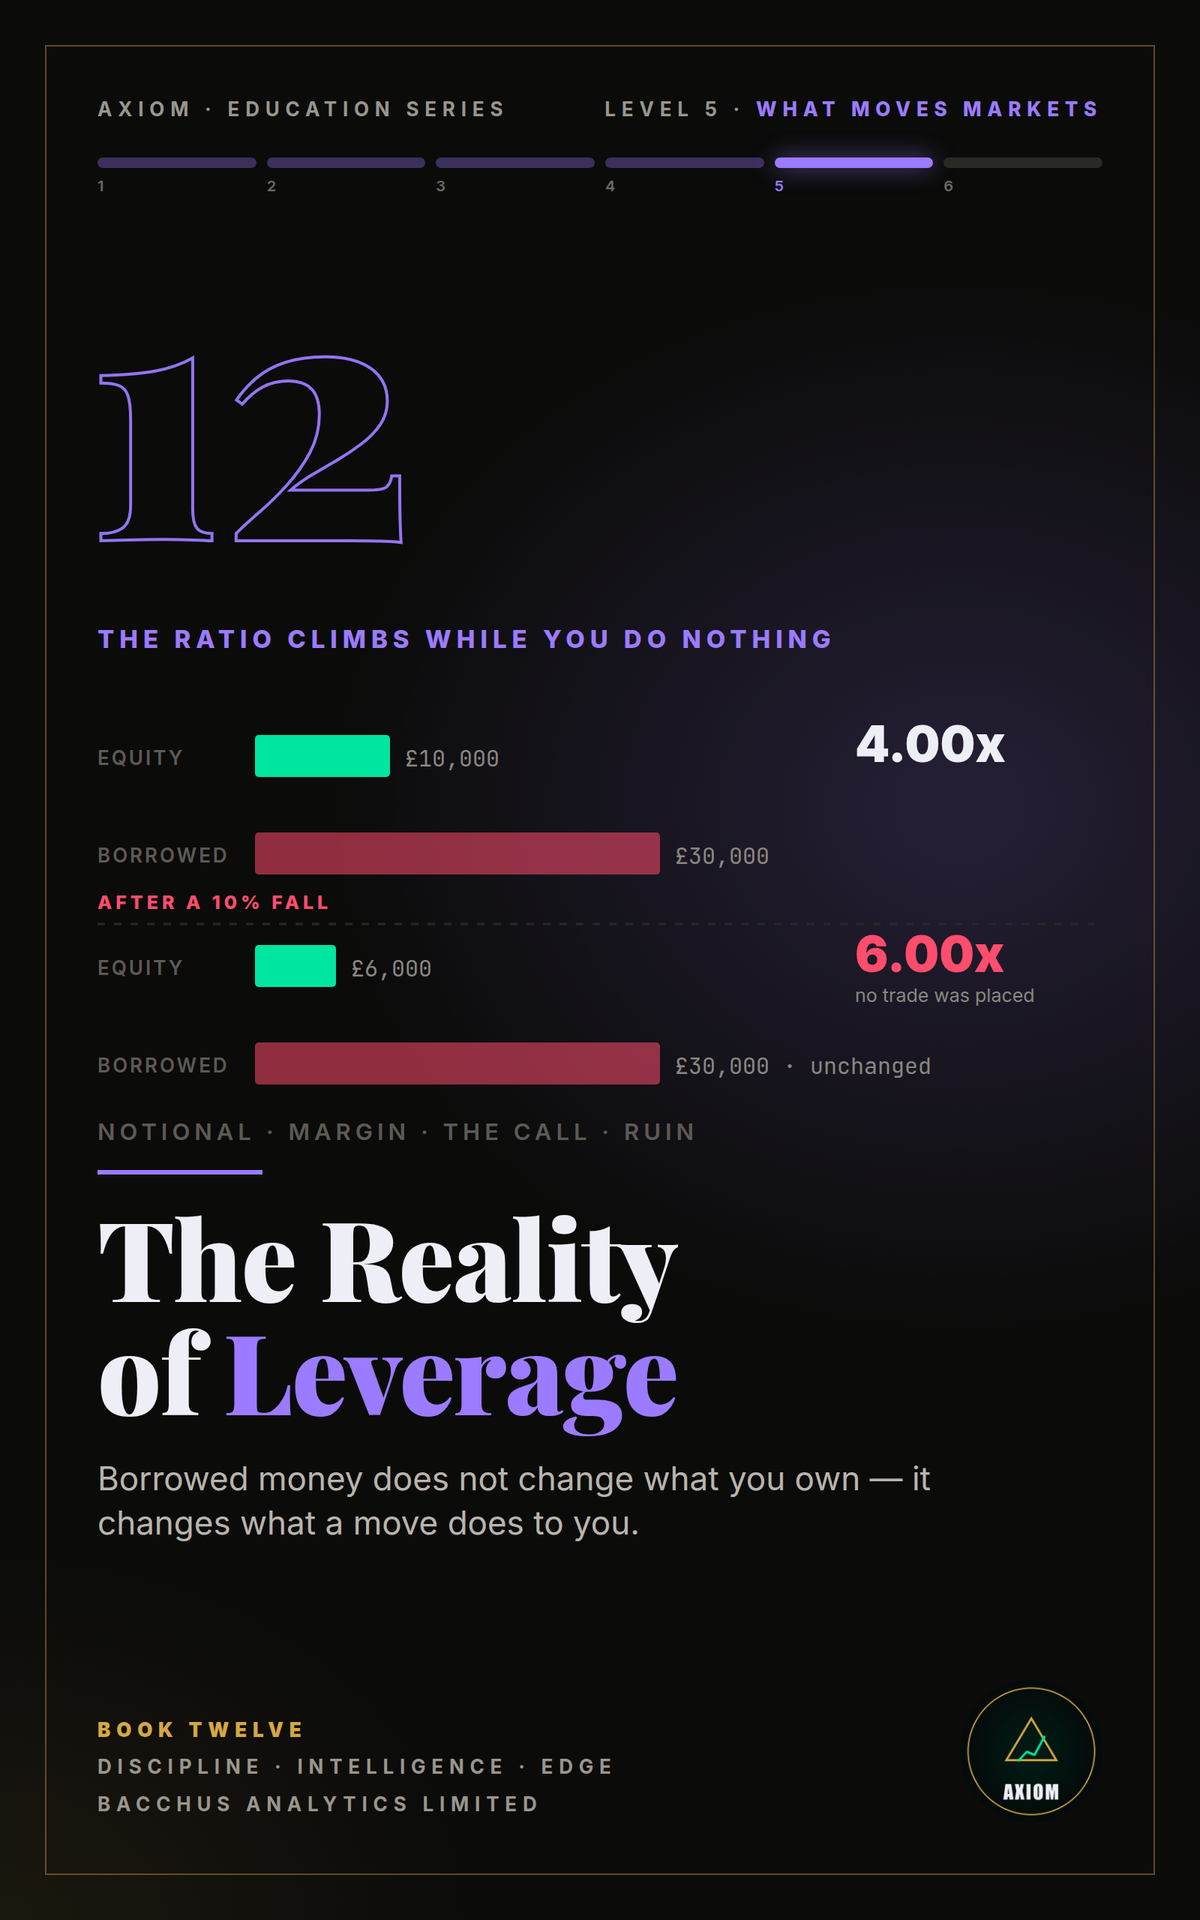
The Reality of Leverage — AXIOM Education Series Book 12
LEVEL 5 · WHAT MOVES MARKETS · BOOK 12
In the first half of 2026 a hedge fund returned 439% net to its investors. By the end of July it had sold its entire public equity book to Citadel in a single pre-market block.
Those two facts are not a reversal. They are the same fact, observed from two ends — and the mechanism that connects them is available at your broker tonight, at a far higher setting than the one that fund was using.
Borrowed money does not change what you own. It changes what a move does to you, and it changes it in a direction that gets worse exactly when you can least afford it.
- The ratio that climbs while you do nothing — a 10% fall on a 4× position takes 40% of your equity, and leaves you at 6.00× without a trade being placed. The debt does not shrink; the loss lands entirely on your side of the quotient
- The move that ends you is 100 ÷ leverage — 25% at 4×, 1% at 100×, and 0.2% at the 1:500 some brokers advertise. On many instruments that is the spread at the Sunday open
- Why forced sellers dump their best assets — a margin call is answered with whatever can be sold at a fair price today, which is never the thing that is failing. Why one position in the case study survived untouched: nothing had been borrowed against it
- Filed, held, controlled — the fund's mandatory public filing covered 4.13% of it. What a 13F actually excludes, why two contradictory position lists can both be accurate, and why you are reading your own version of that filing every time you open the positions tab
- The central table — hold the edge constant at a genuinely good 55% win rate and move only the leverage: ruin runs from 0.00% to 37.49% over 200 trades. Same trader, same strategy, same market
- The row where it turns — past roughly 8% risk per trade, more leverage makes you both likelier to be wiped out and poorer if you survive. Not a trade-off; strictly worse on both axes, two notches of a slider apart
- What correlation does to all of it — 26 positions in one theme are 1.24 effective bets carrying 4.58× the combined risk, which takes a 3% chance of ruin to better than one in five
- The cost of carrying — financing at 4× is 16.5% of your equity a year before you are right about anything. At 10× it is roughly half
- What the de-risk ladder is worth — halving at −10% and again at −20% takes ruin at 4% risk from 28.17% to zero. What it costs in upside is stated too
Every simulation in this book is reproducible by you, for free. Chapters 9 and 11 run their figures through the Risk of Ruin Simulator on this site, and Appendix C gives the exact slider settings for each table. Nothing has to be taken on trust.
Seven full-colour diagrams, the arithmetic on one page, and a full sources appendix. Assumes Books 1 to 11.
Honest note: the case study's reported figures disagree with each other — the peak is given as $45bn by some outlets and ~$24bn by another, a 1.88× gap. This book shows the disagreement and computes both rather than picking the dramatic number, and one widely repeated statistic that could not be verified was dropped entirely. No allegation of wrongdoing is made or implied.
Instant PDF download, 105 pages, in colour, readable on phone, tablet or desktop.
Educational purposes only, not trading or financial advice. Most retail CFD accounts lose money; trading leveraged products carries a high risk of losing your money.