Reading Currency Strength — AXIOM Education Series Book 11
LEVEL 5 · WHAT MOVES MARKETS · BOOK 11
A currency never moves alone. When EUR/USD rises you cannot tell from that chart whether the euro strengthened, the dollar weakened, or both — all three produce an identical line.
A pair chart shows you a relationship. A strength meter shows you which side of it is responsible.
And it does something more useful than choosing a pair, which almost nobody uses it for: it tells you, before you place anything, which of your candidate trades are secretly the same trade.
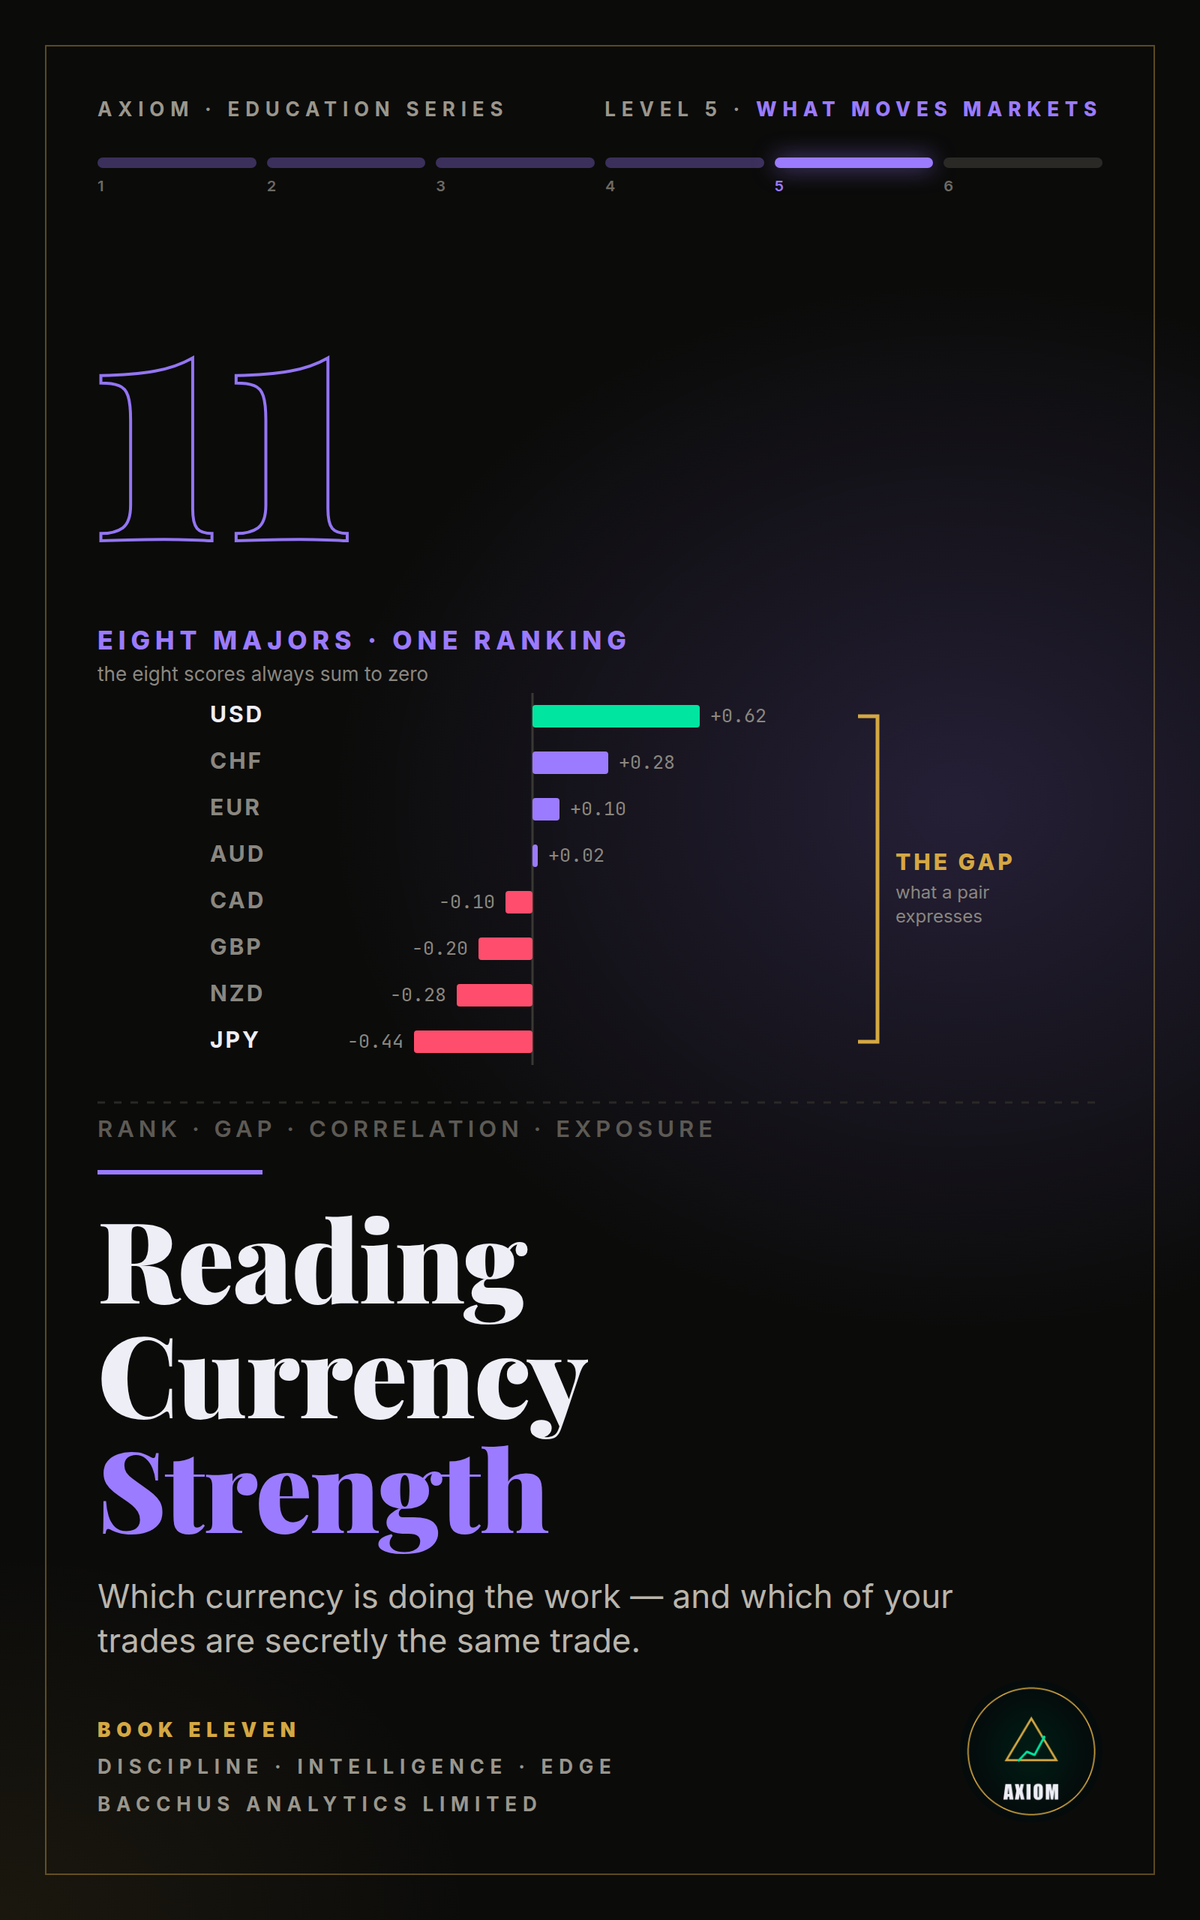
- The arithmetic nobody mentions — a meter's eight scores sum to exactly zero, always, because every move enters the calculation twice with opposite signs. So "everything is strong today" is impossible, a currency can climb the ranking without moving, and the top of a meter is partly manufactured by the bottom
- A worked day that shows the trap — the yen falls 1.8%, the dollar genuinely adds 0.4%, and the meter reads the dollar at +0.600%, of which 43% is nothing but the yen falling. Six currencies that did not move against each other at all sit in the upper half of the display
- Every meter is a recipe — the input, the window and the basket all change the answer, and a reading with no stated window cannot be acted on. Why a normalised 0–100 bar is a ranking, not a measurement
- The meter and the matrix — what each view answers, and why the middle of the table is usually noise whatever the bars look like
- Pairing — the leader against the laggard, and why strong-vs-strong and weak-vs-weak have no gap to trade. Graded honestly: plausible as a selection heuristic, untested as a strategy
- Timeframes, alignment and rotation — why agreement across windows is one witness repeating itself, not three witnesses agreeing
- Correlation, and where it really comes from — in FX it is structural and readable straight off the pair names, which means it is knowable in advance
- Three tickets, one bet — the three widest gaps usually share the leading currency. Three disciplined 1% trades at typical dollar-pair correlation is 1.25 effective bets and a single 2.68% exposure — inside the total cap, over the per-theme one. The rule you were not watching
- Counting exposure in currencies, not tickets — a fifteen-second tally that needs no correlation coefficient and works as a veto before the entry
- A week with the meter, worked end to end — five days in which the correct decision is twice to do less than the screen appears to offer
Six full-colour diagrams, a printable strength card, glossary and sources. Every constructed figure is labelled as constructed and every piece of arithmetic can be rebuilt in a spreadsheet — which Chapter 2 asks you to do. Assumes Books 1 to 10.
Honest note: there is no published test of strength-meter trading, in either direction. This book says so three times rather than papering over it, and Chapter 12 is how to find out for yourself.
Instant PDF download, 114 pages, in colour, readable on phone, tablet or desktop.
Educational purposes only, not trading or financial advice. Currency-strength readings and correlations are descriptive, not predictive, and correlations break down in stressed markets. Most retail CFD accounts lose money; trading leveraged products carries a high risk of losing your money.